Plot Function for Block-Structured Precision Matrices (Visualize a Matrix with Group Boundaries)
Source:R/plot.blkmat.R
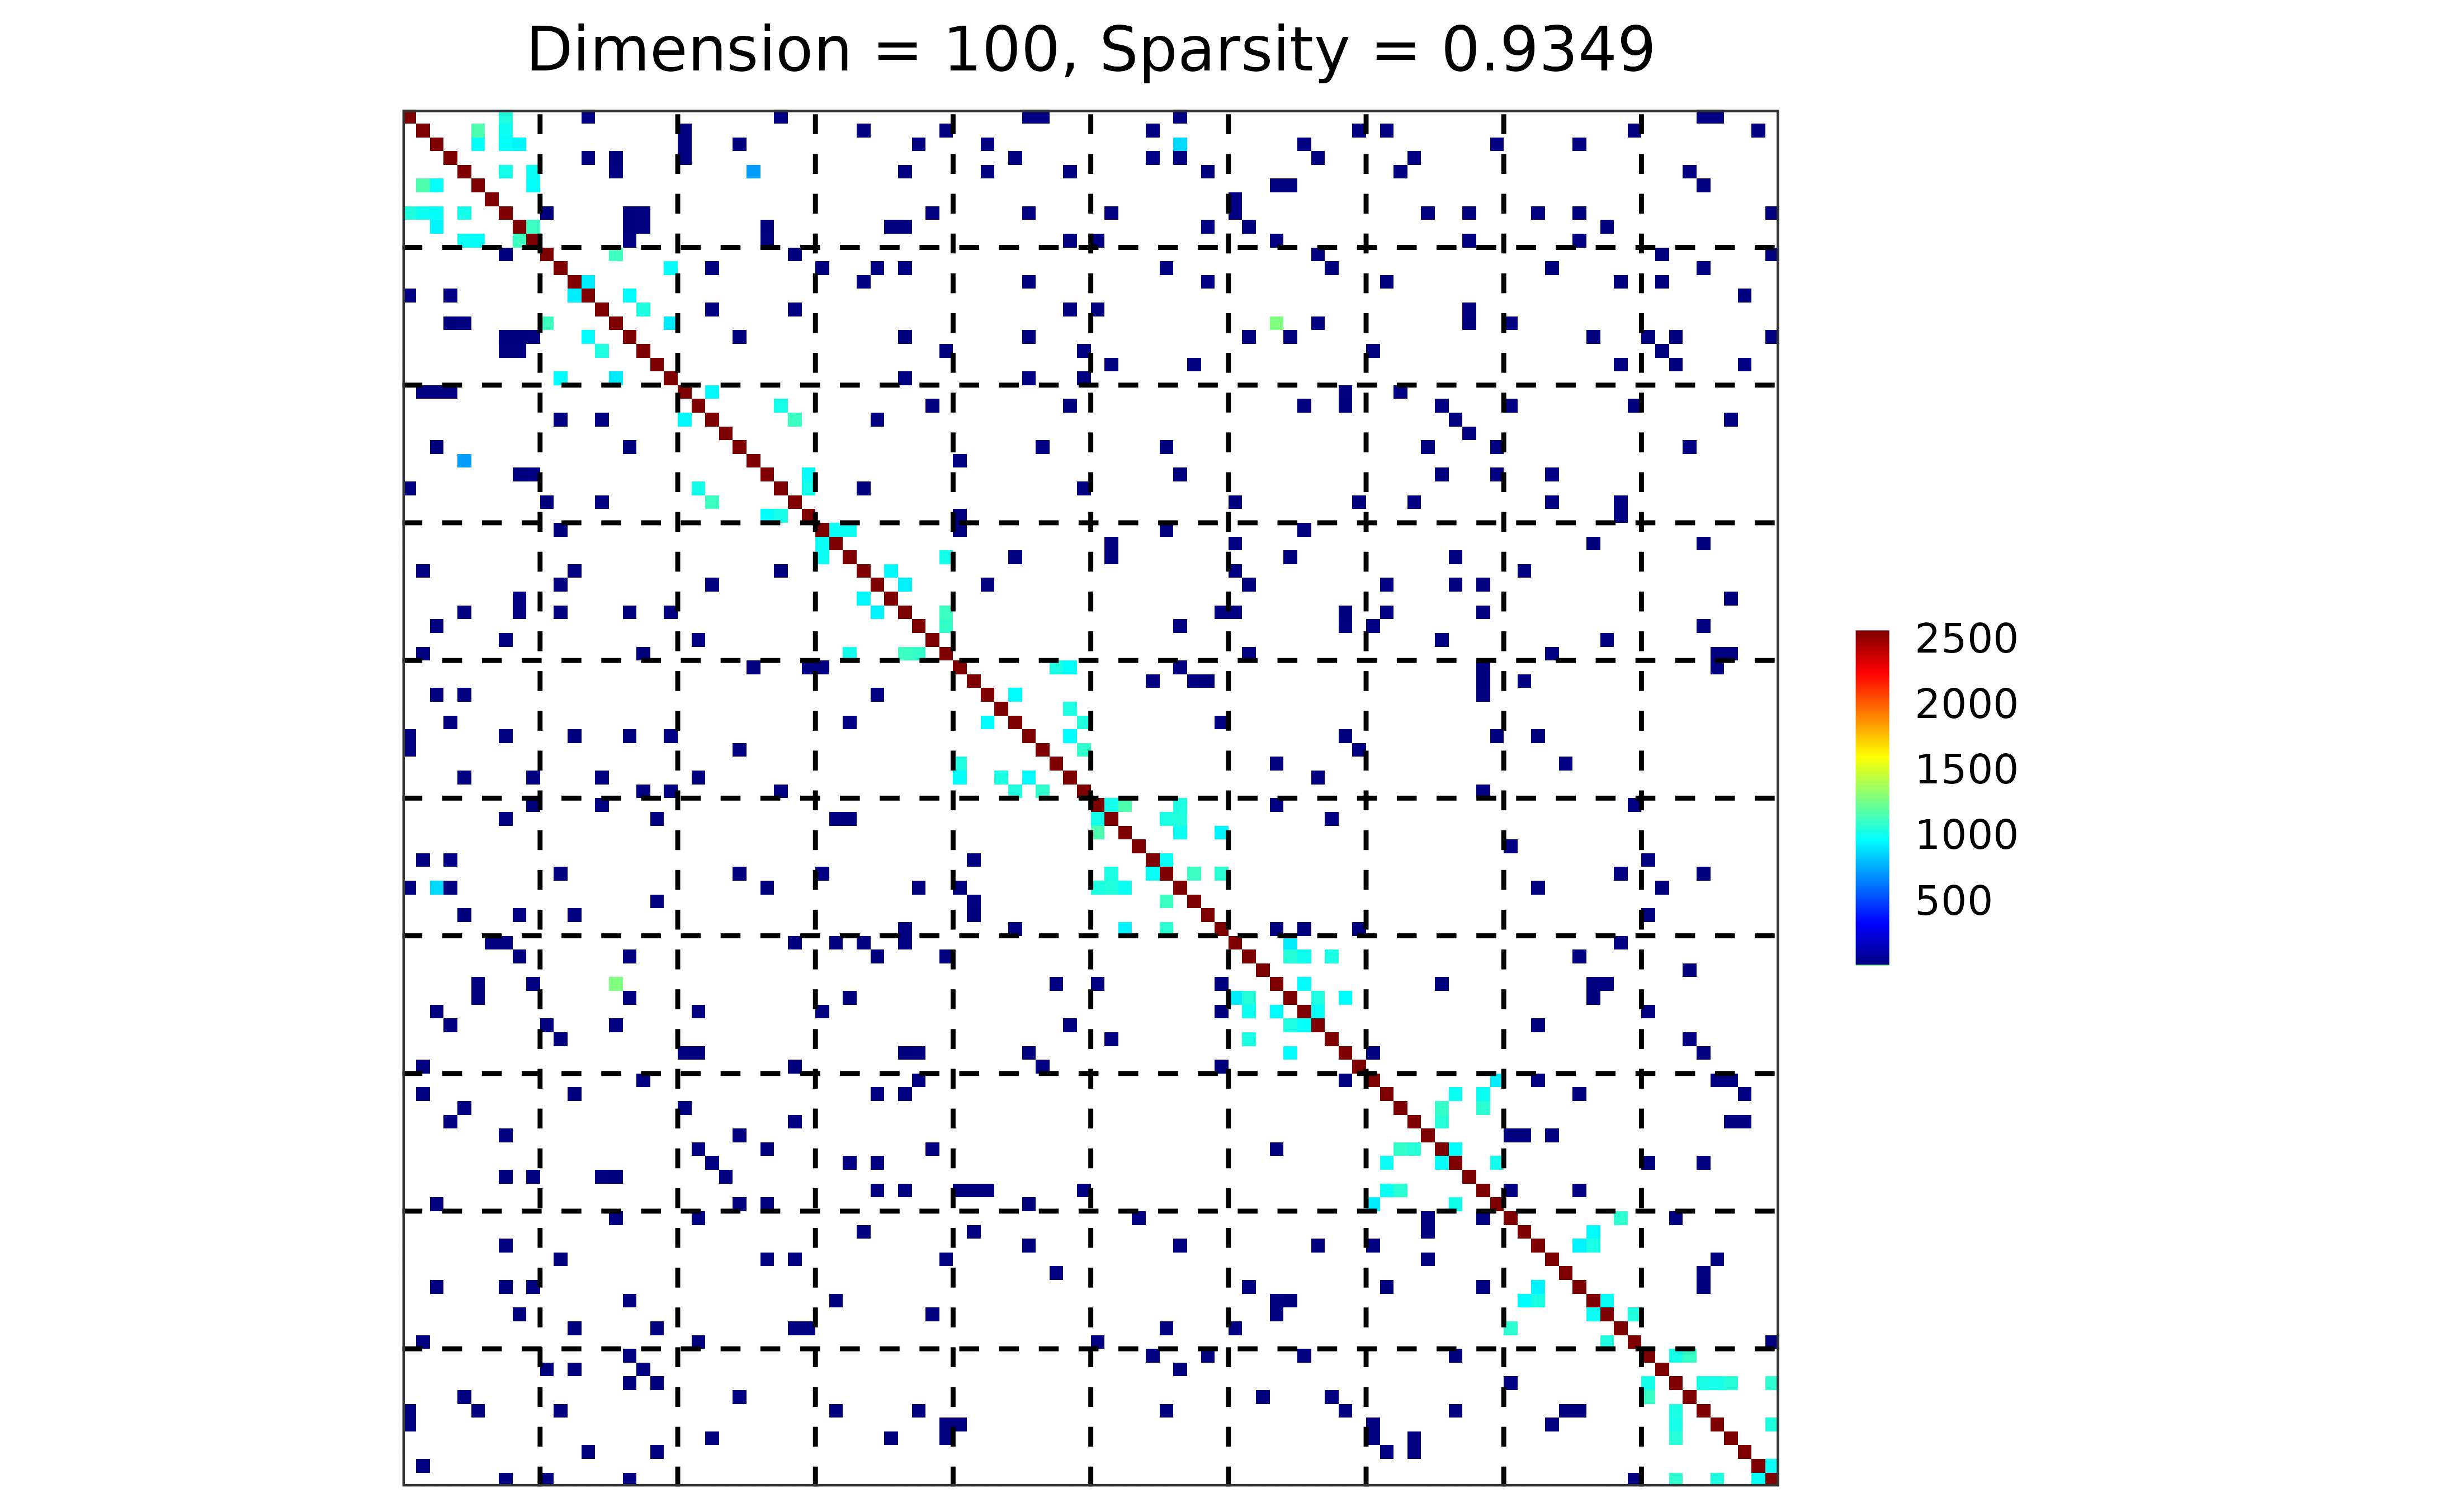
plot.blkmat.RdVisualize a precision matrix as a heatmap with dashed boundary lines
separating group blocks. This function is shared by objects returned from
grasps, gen_prec_sbm, and
sparsify_block_banded, all of which inherit from
the S3 class "blkmat".
Usage
# S3 method for class 'blkmat'
plot(x, colors = NULL, ...)
Arguments
- x
An object inheriting from S3 class
"blkmat", typically returned bygrasps,gen_prec_sbmorsparsify_block_banded.- colors
A vector of colors specifying an n-color gradient scale for the fill aesthetics.
- ...
Additional arguments passed to
ggplot.
Value
A heatmap of class ggplot showing the matrix entries.
Dashed lines indicate group boundaries.
The plot title also reports matrix dimension and sparsity.
Examples
library(grasps)

## reproducibility for everything
set.seed(1234)

## block-structured precision matrix based on SBM
sim <- gen_prec_sbm(p = 100, K = 10,
                    within.prob = 0.2, between.prob = 0.05,
                    weight.dists = list("gamma", "unif"),
                    weight.paras = list(c(shape = 100, scale = 10),
                                        c(min = 0, max = 5)),
                    cond.target = 100)

## visualization
plot(sim)